Small brain studies can make BMI effects look far larger than they are
A study of 3,401 MRI scans found that cross-validation exposed brain-imaging effects that failed to generalize from small samples.
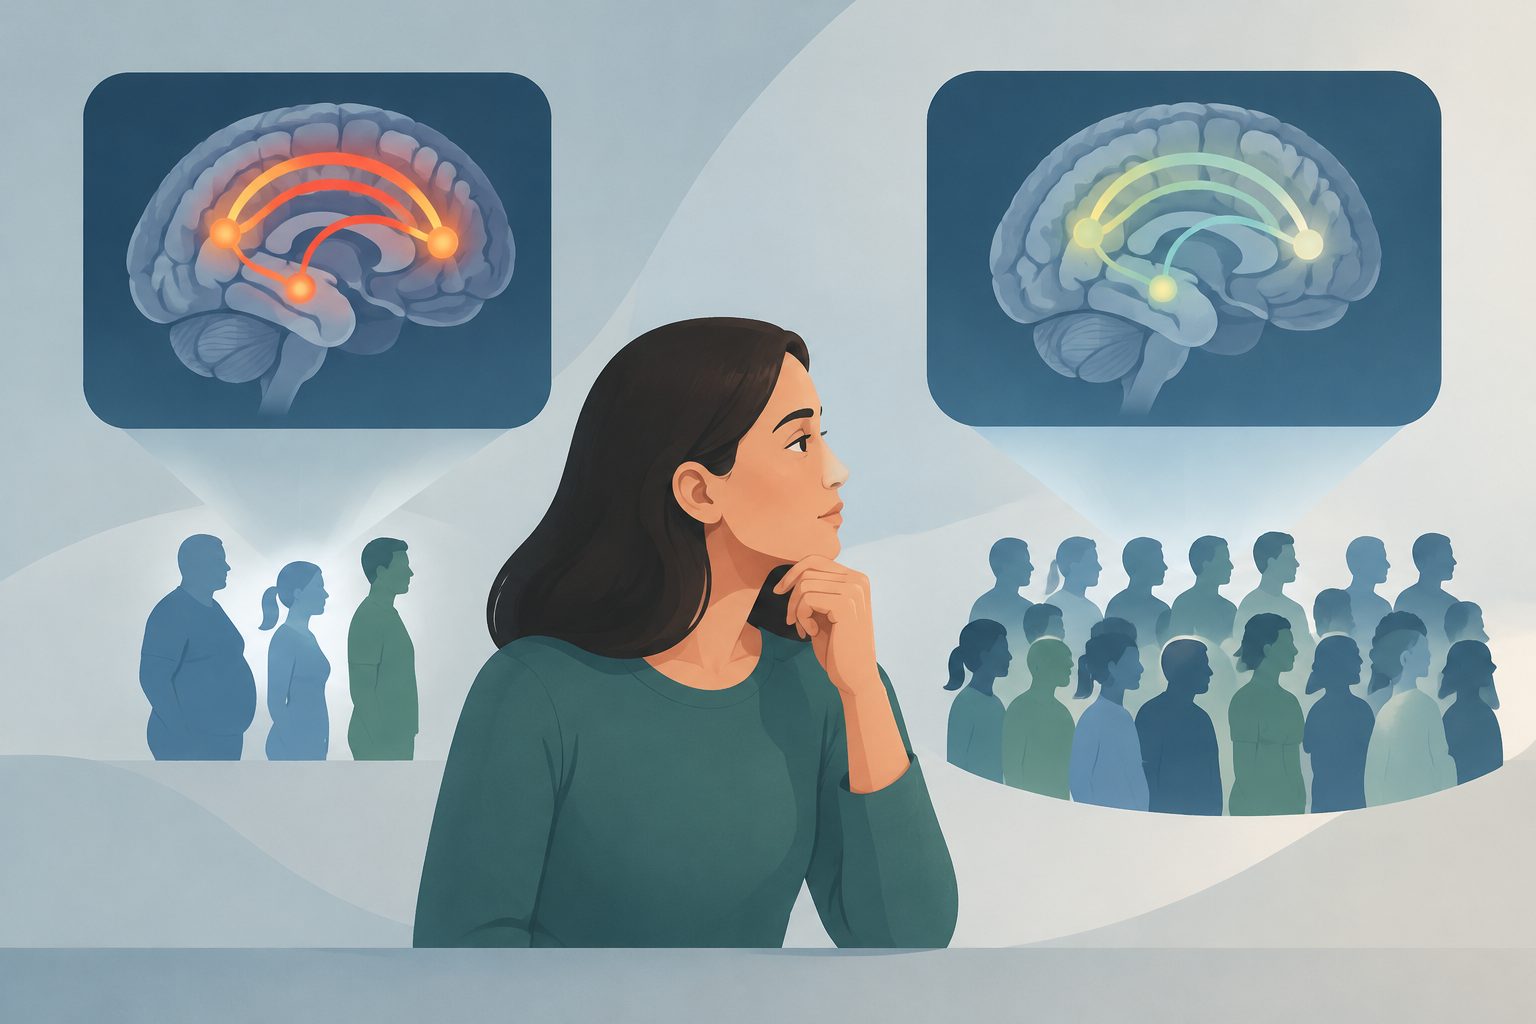
Editorial illustration — not from the study.
Researchers analyzed 3,401 MRI scans from three German cohorts, including people with major depressive disorder and healthy participants. They examined the association between body mass index and gray matter density across the brain, comparing ordinary analyses with analyses that tested effects on new data.
In the full sample, the largest underlying effect explained 3.6% of the variation in gray matter density. Without cross-validation, however, small samples produced estimates as high as 53.5%, including estimates as high as 42.9% when the underlying effect was actually zero.
When brain effects hold up
Body mass index was negatively associated with gray matter density, with a largest underlying partial R² of 0.036 in all 3,401 scans. In small samples analyzed without cross-validation, estimated effects reached partial R² values of up to 0.535. Even when there was no underlying effect, samples of 25 produced estimates as high as 0.429.
When the researchers used cross-validation—testing findings on data not used to estimate them—the inflated effects from small samples did not generalize. The largest brain-wide effects began to generalize at a sample size of about 100, while smaller effects required about 400 participants. No point of initial generalizability was reached for effects with no underlying association, even using all 3,401 scans.
Why new-data testing matters
A large effect in a brain-imaging study may partly reflect the instability of a small sample rather than a relationship that will appear in new participants. Testing effects on new data gives researchers a way to identify this problem alongside conventional significance tests and effect-size estimates.
The authors suggest that routinely using cross-validation in brain-wide, voxel-by-voxel association studies could help address poor replicability and generalizability. They also provide open-source code for applying the approach.
Evidence and caveats
The study is a statistical evaluation based on 3,401 MRI scans from three German cohorts. It used body mass index as an example predictor and gray matter density as the brain measure, with age, sex, total intracranial volume and scanner differences included as nuisance variables. The analysis examined associations, not whether body mass index causes changes in brain structure.
The findings may not apply in the same way to other predictors, brain measures, populations or study designs. Body mass index was calculated from participants’ self-reported height and weight, and the sample combined people with major depressive disorder and healthy participants. The study shows that cross-validation can expose poor generalization in this setting; it does not by itself establish that every small neuroimaging study produces an inflated effect.
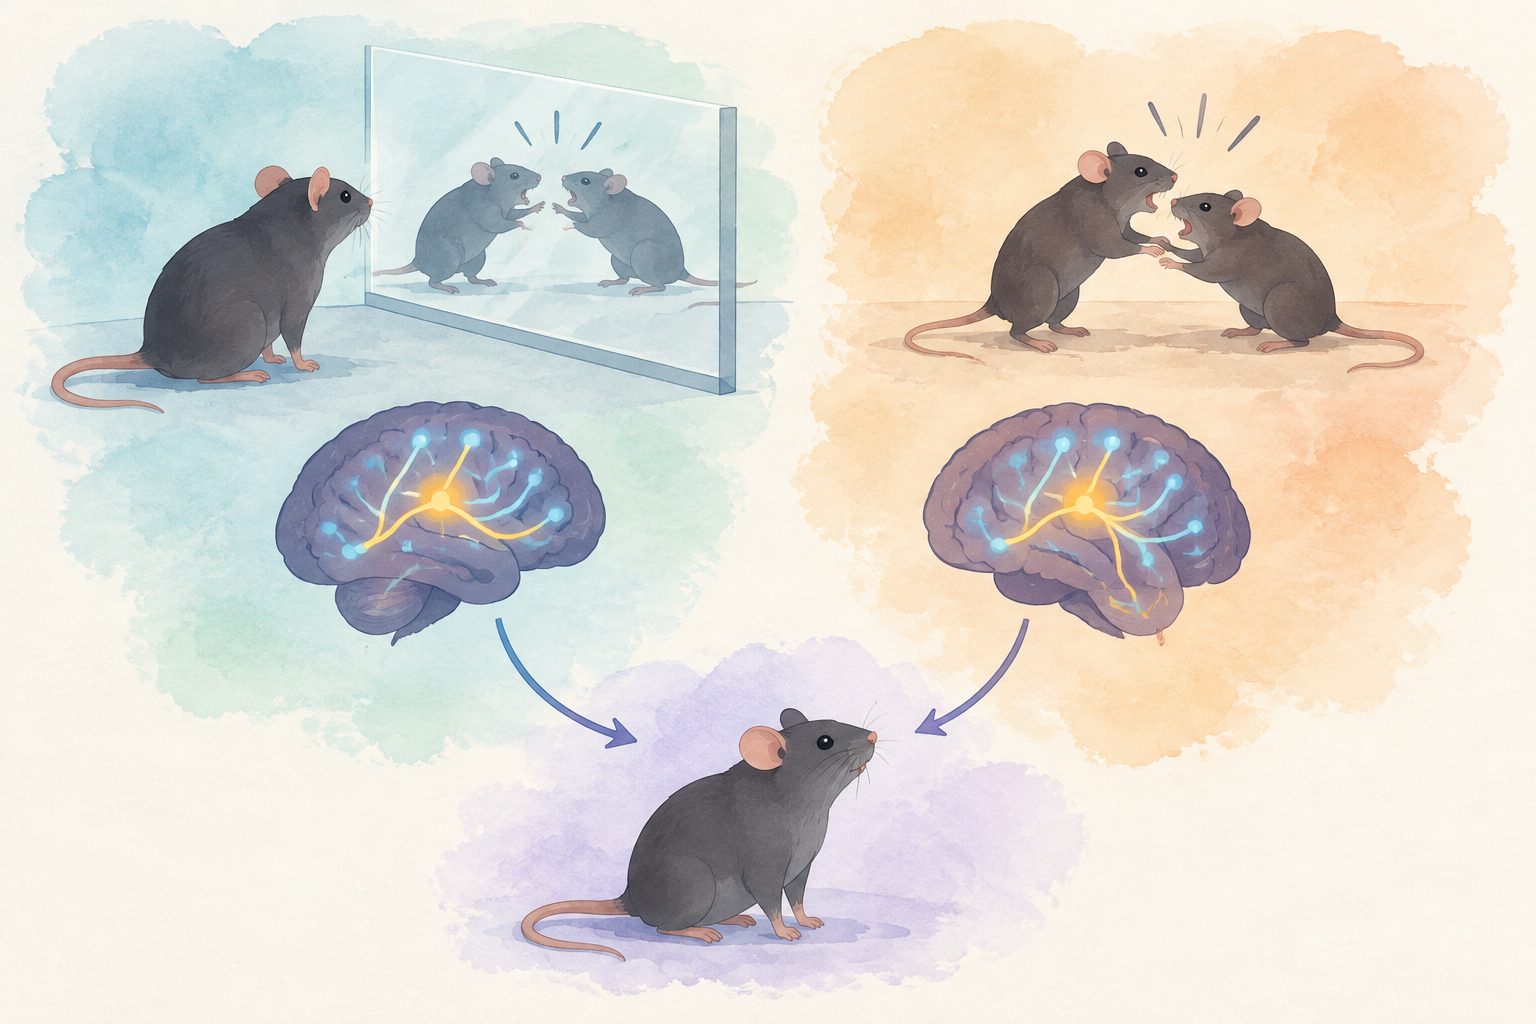
Mice that observed aggressive encounters developed lasting behavioral and brain changes resembling those seen in mice that directly experienced aggression. These changes persisted when the animals faced a new, more challenging aggression context.
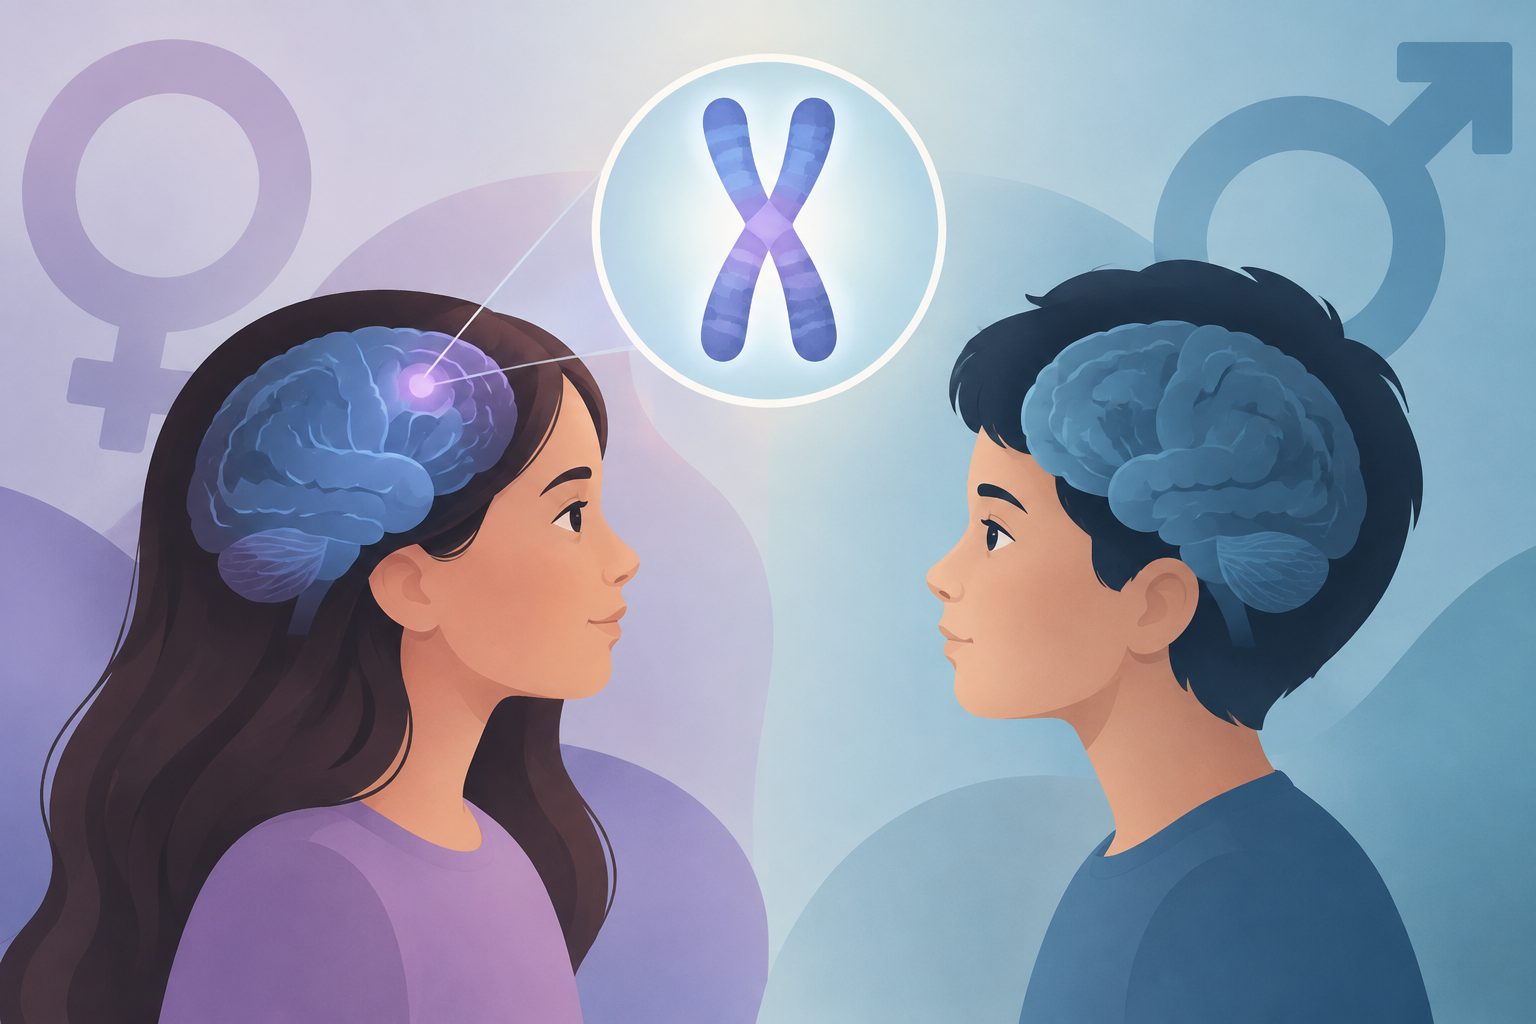
Researchers found that disrupting 18 different autism-linked genes in human neural progenitor cells produced overlapping changes in gene activity. The results point to the X-linked gene ZFX as a possible contributor to the lower autism vulnerability seen in females, although the proposed protective effect still needs to be tested directly.
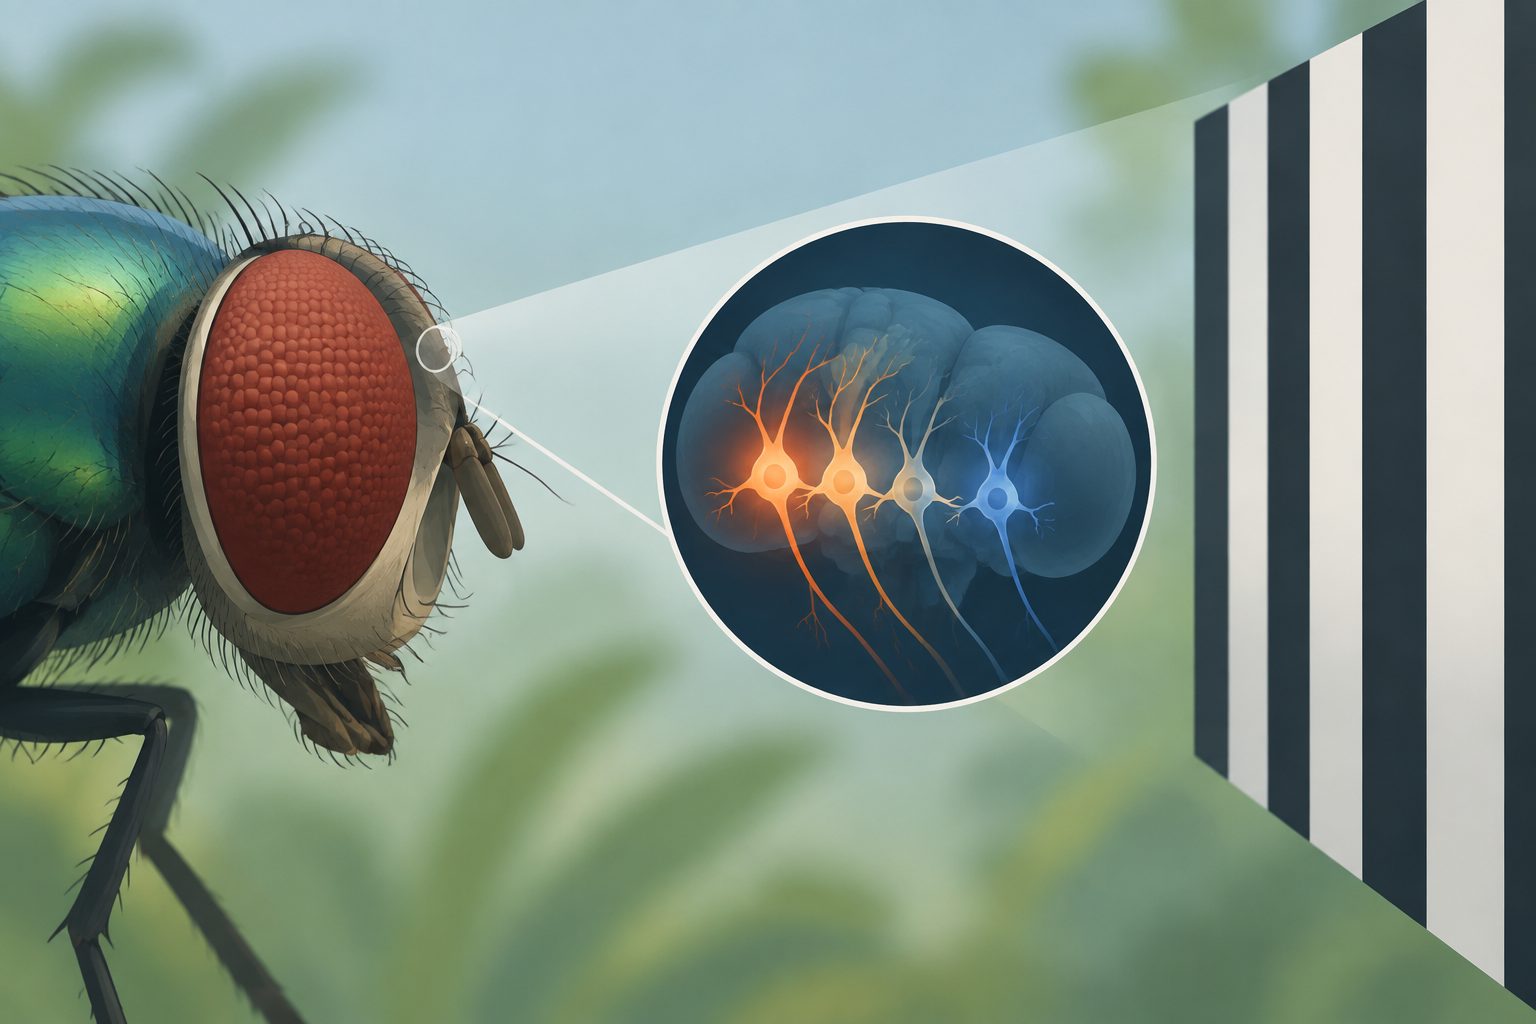
A study proposes a broader way to explain how sensory neurons use limited resources, allowing them to optimize goals other than maximizing information. Reanalyzing classic blowfly data, the researchers found that the neurons’ response pattern was better matched by reducing average square-root reconstruction error than by maximizing mutual information.