A study found these overlapping risks in areas with high numbers of marine species.
Researchers combined species-abundance information with environmental and human-pressure data to map where multiple stressors might interact. They used two unsupervised approaches: one based on clustering and another based on an artificial-intelligence model that identifies unusual data patterns, then compared their results through ensemble maps.
The models found concentrated hotspots in species-abundant areas, with the strongest patterns involving depleted bottom oxygen, depth-related constraints and fishing pressure. The two approaches agreed in some areas while highlighting different patterns, supporting a combined map intended to inform ecosystem-based management.
Where risks overlapped
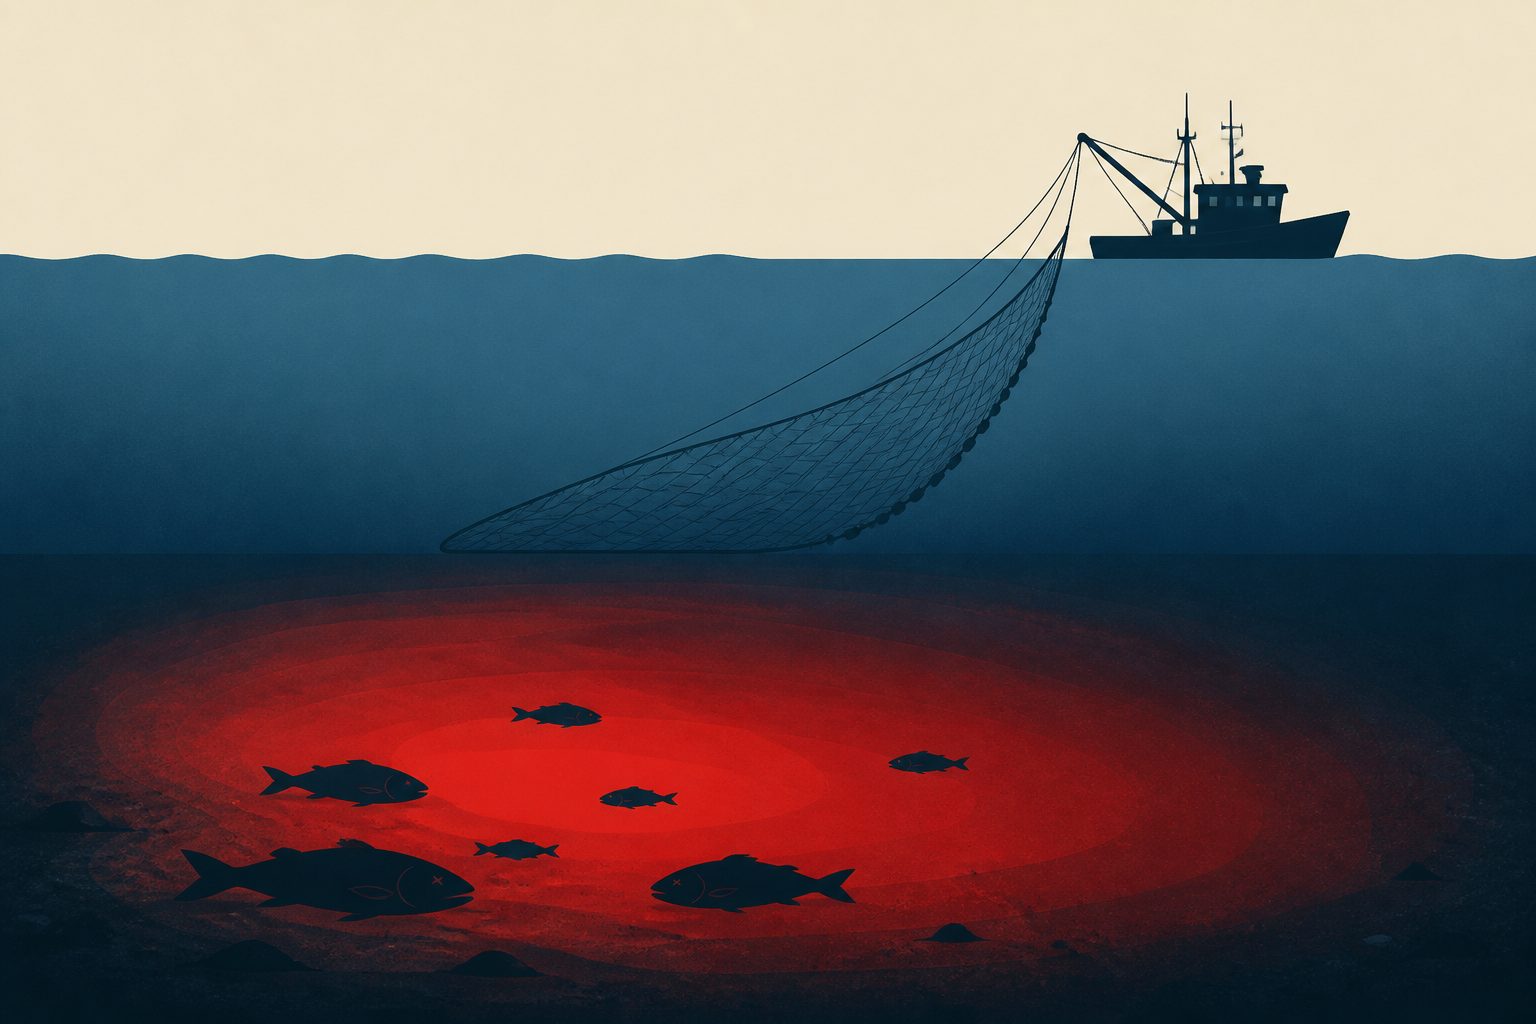
The analysis identified spatially concentrated risk hotspots in the central and western Baltic Sea. These hotspots were associated with areas rich in species where bottom-oxygen depletion, depth-related constraints and fishing pressure occurred together.
The study assessed 2020 data that included abundance information for 145 marine species, commercially relevant species and cod. The clustering model mainly identified persistent risk patterns linked to chronic environmental stress, especially in deeper offshore areas with stable low-oxygen conditions. The artificial-intelligence model combined with clustering was more sensitive to unusual, non-linear combinations of stressors, including patterns associated with cumulative human pressures in coastal and transitional areas.
The researchers found agreement between the two approaches, while also identifying differences that reflected their distinct analytical perspectives. Their combined model brought these views together in a single risk assessment map.
Why the hotspots matter
Risk maps that show where several pressures overlap with biological sensitivity can help inform spatial planning, conservation and ecosystem-based management. The study's multi-model approach is intended to reduce reliance on expert-assigned weights while retaining an interpretable link between stressor patterns and species abundance.
Because the approach can compare risk patterns across different species groups and data sources, the researchers present it as a tool that could be adapted to other large-scale ecosystem assessments. The findings also draw attention to species-rich areas where oxygen conditions and fishing pressure coincide, rather than treating each pressure in isolation.
Evidence and caveats
This was a model-based assessment using multi-source data from 2020 in the central and western Baltic Sea, not a direct experiment or a demonstration that the identified stressors caused ecosystem change. The maps show where stressors and biological sensitivity were likely to interact; they do not establish future effects or prove that a hotspot will undergo a particular ecological transition.
The results were compared across two unsupervised models and were described as consistent with previous expert studies. However, the artificial-intelligence model's unusual patterns were not treated as direct evidence of ecosystem risk; researchers interpreted them using the original stressor data and species-abundance information. Although the method avoids expert-assigned stressor weights, researchers still made choices about data selection and preprocessing. The analysis also focused on one year and a defined part of the Baltic Sea, so the excerpts do not establish how the patterns change over time or whether the results apply elsewhere.