Thermal images helped track water loss and detect early stress in sugar beet, potatoes and winter wheat across three seasons.
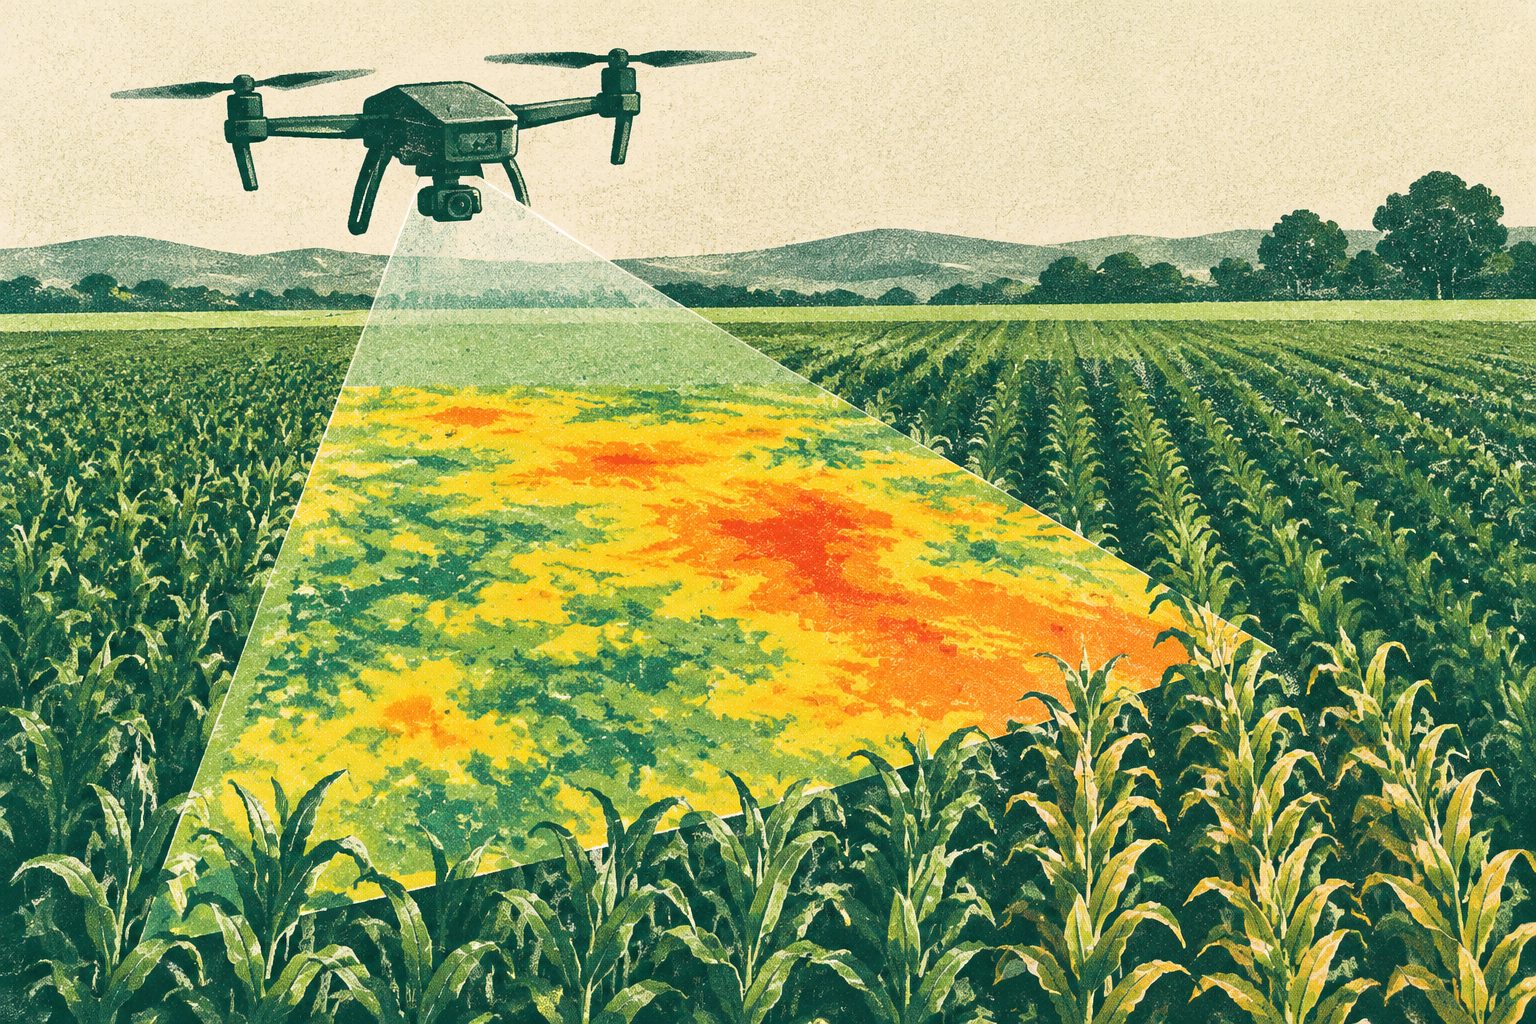
Researchers combined thermal, multispectral and laser-based drone data with an energy-balance model to estimate evapotranspiration at 15-centimeter resolution across a 10-hectare field. They studied sugar beet in 2021, potato in 2022 and winter wheat in 2023.
Thermal data provided early signals of water stress before metrics derived from the other sensors changed. A measure based on green plant area better captured declines in functioning vegetation than a measure of total plant structure, particularly as winter wheat entered senescence, or natural aging.
What the drones detected
The researchers used the Priestley–Taylor Two-Source Energy Balance model with drone observations to estimate field-scale evapotranspiration. The model used thermal infrared data for surface temperature, multispectral data for green plant area, and laser-based data for plant structure.
Evapotranspiration estimates agreed well with measurements from an eddy-covariance system, with a root mean square error of 0.14 millimeters per hour and an R² of 0.49. Agreement improved to an R² of 0.81 when senescence periods were excluded. Thermal infrared maps revealed crop water-stress signals before multispectral or laser-based plant measures changed.
The estimates were highly sensitive to surface temperature, making accurate thermal calibration important. Green plant area and total plant area gave similar inputs during peak growth, but green plant area more effectively represented declining canopy function during stress and senescence, especially in winter wheat, whose dense structure could create cooling unrelated to transpiration.