Women felt unsafe across travel modes after dark, but few reported concerns
A survey in Australia and New Zealand found that safety perceptions fell after dark while reporting of unwanted behaviour remained uncommon.
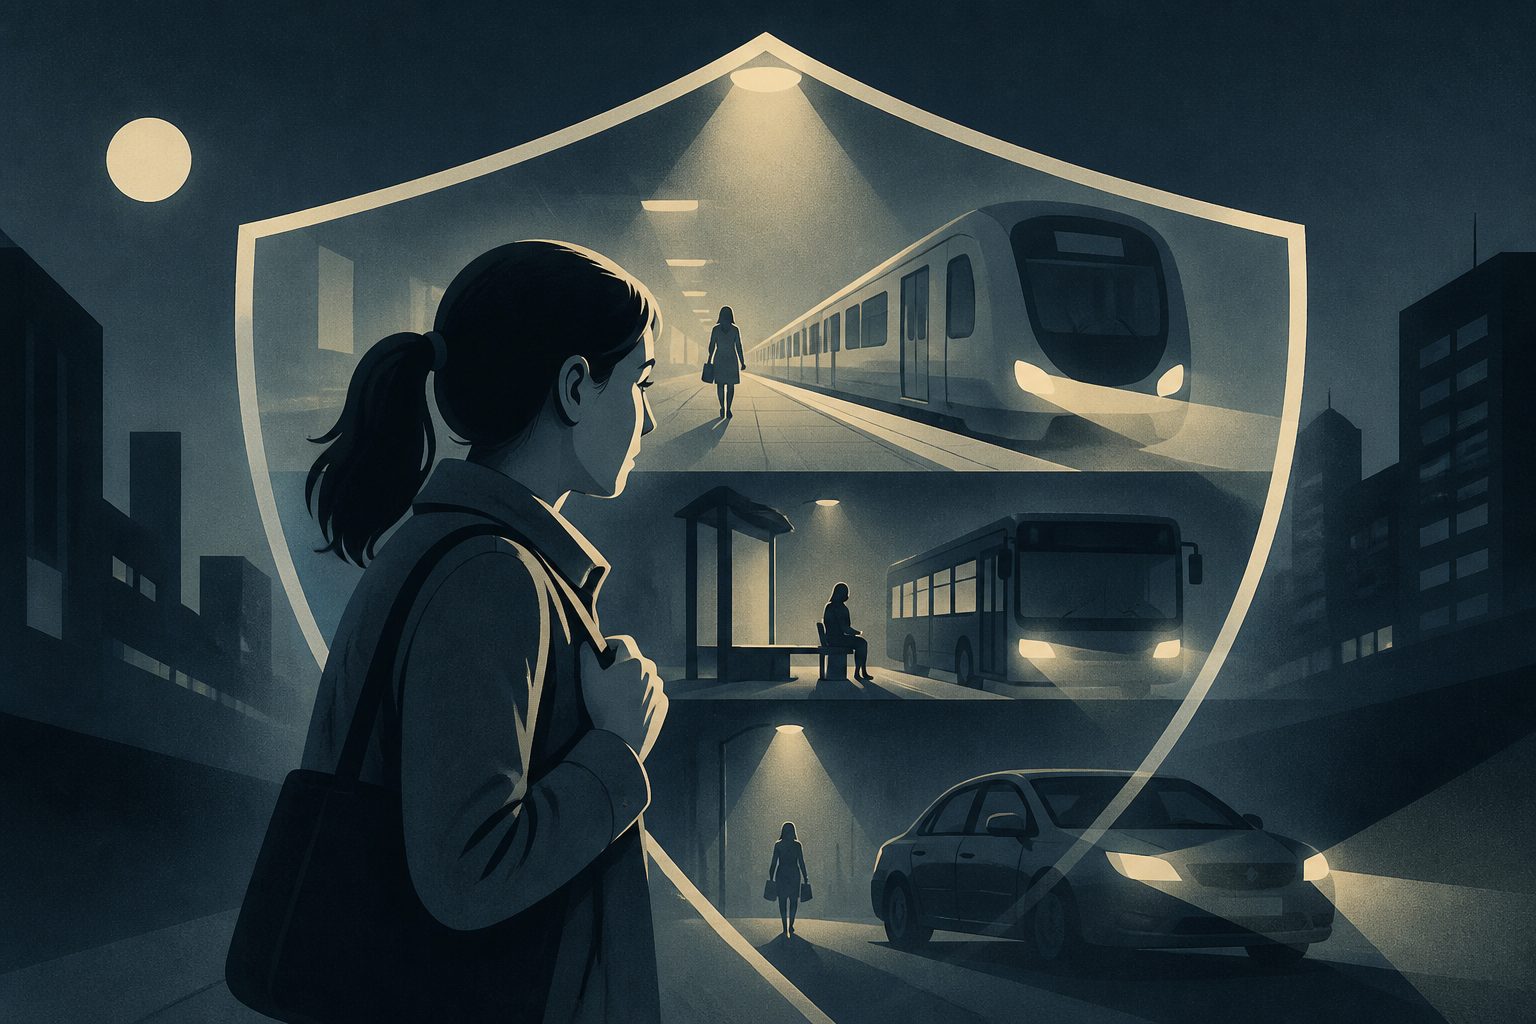
Editorial illustration — not from the study.
Researchers surveyed women aged 18 and older in Australia and New Zealand who walked, cycled or used public transport to travel to or from work or education at least weekly. Of 878 consenting respondents, 642 were eligible for the analysis, with an average age of 42.6 years.
Perceived safety varied with the time of day, the type of infrastructure and the stage of a journey. Women generally felt safer on public transport during the day than after dark, while walking to or from stops and waiting after dark were among the least safe parts of the journey. The researchers say improvements should include better lighting and surveillance, protected cycling infrastructure, monitored waiting areas and clearer reporting systems.
Safety changed across journeys
Only 25.2% of respondents felt safe walking after dark, and 34.4% felt safe cycling after dark. Cycling infrastructure made a large difference: 72% felt safe in dedicated bicycle lanes, compared with 16.3% on shared roads.
Most respondents felt safe on public transport during the day: 76.8% on trains, 73.2% on trams or light rail, 78.6% on buses and 69.4% on ferries. After dark, those figures fell to 30.7%, 34.1%, 34.2% and 38.7%, respectively.
Perceived safety was especially low when walking to or from public transport stops, at 21.0% to 28.0%, and when waiting after dark, at 21.0% to 29.0%. Respondents reported unwanted staring or gestures, being followed or made to feel unsafe, and abusive language across journey stages, particularly on public transport. Reporting rates were low: 13% for walking, 15% for cycling, 18% for trains, 20% for trams or light rail and 17% for buses. Only 21% agreed that there were promising ways to report concerns.
Why the whole journey matters
The findings show that women’s travel safety is not limited to the time spent inside a vehicle or on a particular mode. Safety perceptions changed across the whole journey, especially after dark, including while walking to stops, waiting and using different types of roads or cycling infrastructure.
The results point to practical areas for transport planning identified by the researchers: improved lighting and surveillance, protected cycling lanes, staffed or monitored waiting areas and reporting systems that people trust and can use clearly.
Survey evidence and limits
This was a cross-sectional online survey using self-reported experiences and perceptions. It included 642 eligible women in Australia and New Zealand who regularly walked, cycled or used public transport for travel to or from work or education; the analysis used descriptive statistics.
Because the survey captured responses at one point in time, it can describe patterns but cannot establish causes. The participants were not all women in Australia and New Zealand, so the findings may not represent women with different travel patterns or those who did not take part in an online survey. The low reporting figures also indicate how often respondents reported concerns, not how often unwanted behaviour occurred overall.
// Source
Transportation Research Part F Traffic Psychology and Behaviour · 2026 · DOI: 10.1016/j.trf.2026.103802
Researchers created hydrogel composites that can be reshaped in water by changing the direction of polarized light. The cubes stretched to as much as twice their original side length, and the team made microscopic wells that could fully close.
Researchers combined results from 12 studies involving 770 children receiving extracorporeal membrane oxygenation, or ECMO, a form of life support. Compared with unfractionated heparin, bivalirudin was associated with lower odds of major bleeding, blood clots, neurologic events, and death in the hospital, but the findings do not prove that bivalirudin caused these differences.
A study used detailed imaging of the tiny blood vessels at the base of the fingernail to examine cardiovascular health in 104 healthy adults over 80. People with denser, smaller and less winding vessels tended to have more favorable measures of heart function and arterial stiffness.