A study using climate projections finds drought danger moves to different agro-climatic zones under 2°C, 3°C and 4°C warming—so planning water and farming needs to consider where risk relocates.
More than half of India’s farmland depends on rainfall, so changes in drought frequency, length, and severity can affect both crop yields and water supplies. To capture that combined risk, researchers built a composite drought hazard index for 15 agro-climatic zones.
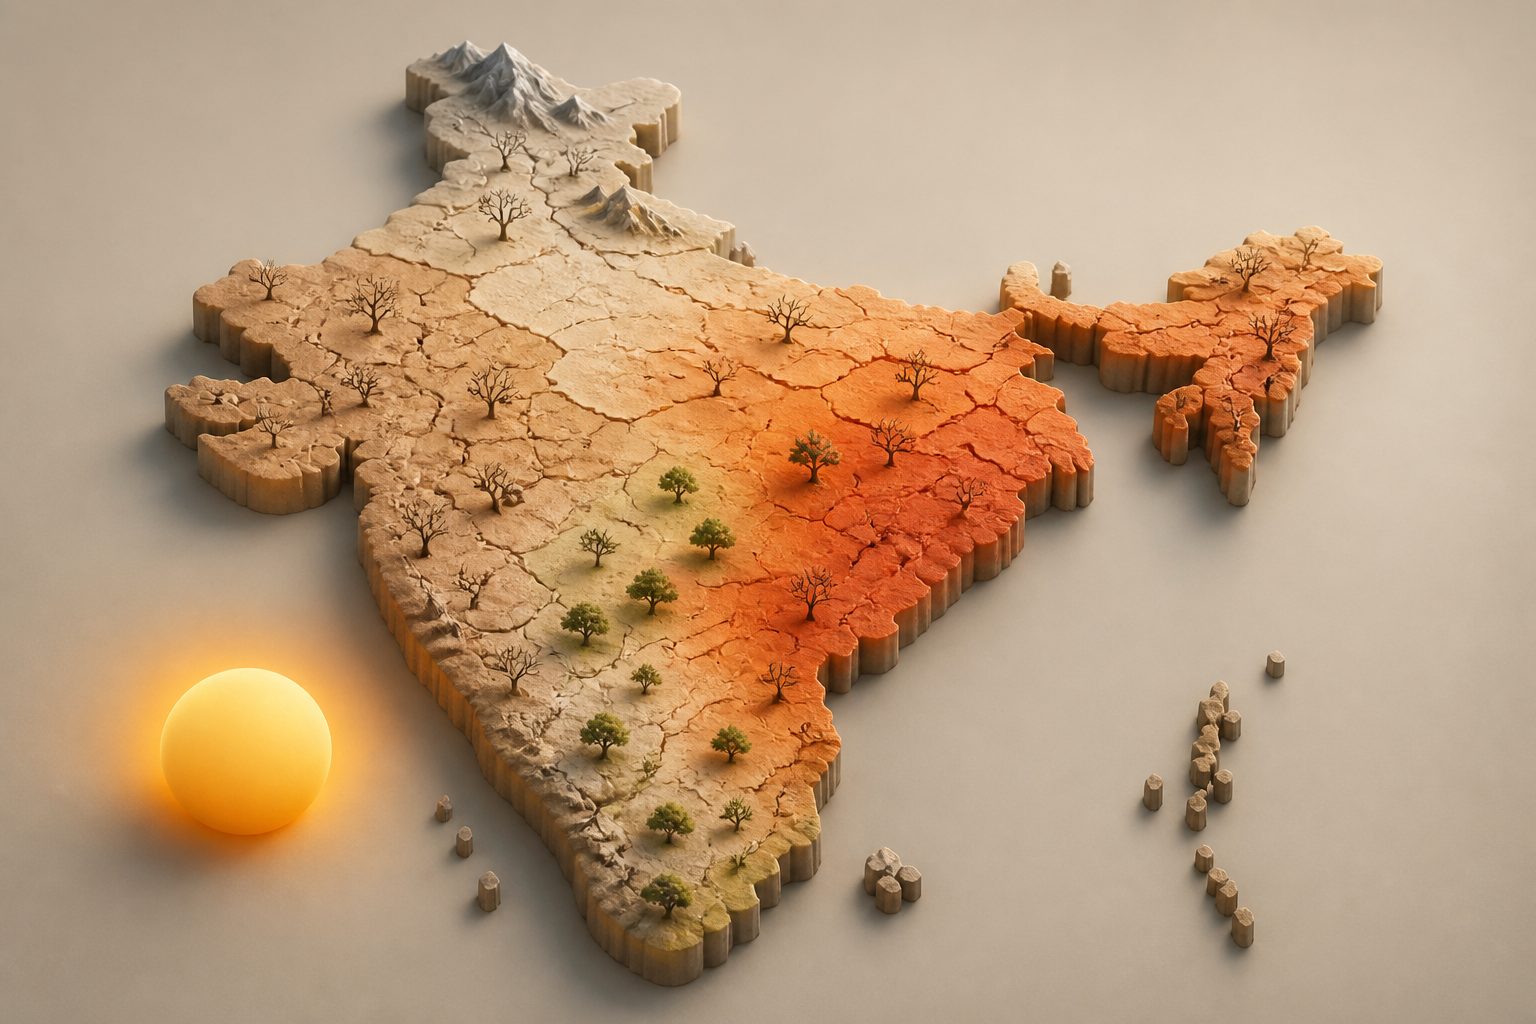
Using CMIP6 climate projections downscaled to 0.25° and comparing a historical reference period (1995–2014) with future 20-year windows for 2°C, 3°C and 4°C warming, the study shows drought hazard generally shifts across regions rather than simply getting worse everywhere in already drought-prone areas.
How drought hazard shifts
The researchers report that drought conditions in the reference period varied by region, with drought event frequency between 1.15 and 2.95 events per year, durations between 1.30 and 3.17 months, and intensities between 0.90 and 1.23. The highest drought hazard index (DHI) values (0.84) were found in the Western Dry Region, Gujarat Plains, and Himalayan zones.
When warming increases, they found broad shifts to higher hazard grades: 56% of India’s land area shifted to a higher hazard grade at 2°C, 47% at 3°C, and 60% at 4°C. The most extreme hazard grade (Grade VIII) expanded from 0.17% of national area to 10.9% under 4°C warming. New hotspots were identified in the Central Plateau, Eastern Plateau, and Upper Gangetic Plain—areas not typically regarded as drought prone. Seasonal amplification was strongest in the pre-monsoon period at 2°C and in the post-monsoon period at 3°C, with winter drying intensifying again at 4°C.
Validation against an independent observed SPEI-based dataset showed mixed skill across zones.
Model-based estimates and caveats
This work is based on a composite drought hazard index built from drought frequency, duration, and intensity derived from the Standardized Precipitation Evapotranspiration Index (SPEI), using bias-corrected CMIP6 projections from the MPI-ESM1-2-LR model (with downscaling to 0.25°). The analysis compares a historical period (1995–2014) to three future 20-year windows aligned with 2°C, 3°C, and 4°C global warming.
Its main limitation is that the authors describe the projections as directional estimates from a single climate model, not definitive forecasts. Validation against an observed SPEI product showed mixed zonal skills, indicating performance varies by region.
// Source
Geoenvironmental Disasters · 2026 · DOI: 10.1186/s40677-026-00402-7
Authors: P. Sreelakshmi, Sawant Sushant Anil
Institutions: JSS Academy of Higher Education and Research