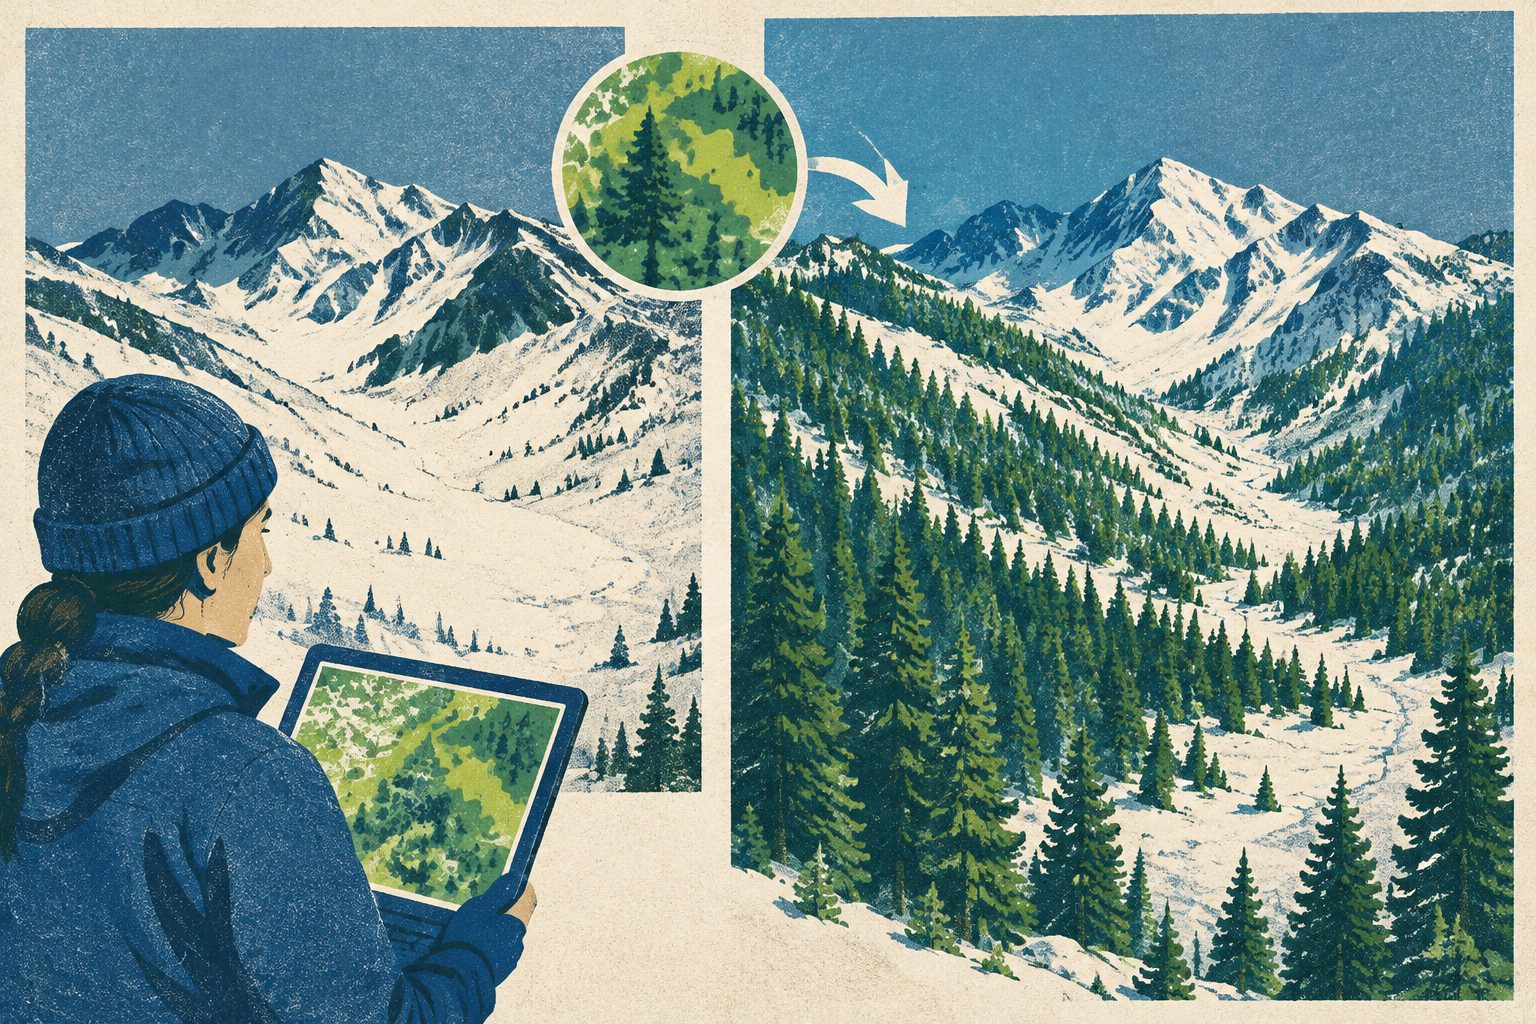
A computer model using changing vegetation conditions and finer weather data matched snow observations better in two California river basins.
Researchers ran eight experiments with a snow and land-surface model at 1-kilometer resolution in the Sacramento and San Joaquin River Basins. The experiments compared two weather datasets and two ways of representing vegetation, including a dynamic approach that estimates changing leaf area and vegetation cover.
The finer weather data based on NLDAS-2 produced more mountain precipitation and lower temperatures than the AORC data, resulting in more snowfall and snow on the ground. With those weather inputs, the dynamic vegetation approach used lower leaf area than the default setup, allowing more sunlight to reach the snow and increasing episodes of melting during the snow-accumulation season. The dynamic setup and downscaled NLDAS-2 data performed best against in-place snow measurements.
How vegetation changed snow
The downscaled 1-kilometer NLDAS-2 weather data produced more precipitation and lower temperatures over the mountains than the 4-kilometer PRISM data and 1-kilometer AORC data. That led to more snowfall and snow water equivalent, the amount of water stored in snow, and was more consistent with in-place snow observations.
When paired with the NLDAS-2 data, the model’s default vegetation setup produced too much snow on the ground. The researchers attribute this mainly to strong shading by the vegetation canopy, even though that setup also intercepted more snow. The dynamic vegetation module produced lower leaf area than the prescribed vegetation values, more closely matching MODIS data. This allowed more sunlight to reach the snow surface and increased episodes of melting during the accumulation season.
Overall, the combination of dynamic vegetation and downscaled NLDAS-2 weather data performed best in comparisons with in-place snow data. It agreed better with the gridded SNODAS snow estimates than the other tested combinations, although it still produced more snow than SNODAS.
Why the estimates matter
Mountain snowpack is an important source of freshwater in California’s Sacramento and San Joaquin River Basins. The study shows that both the weather data used to drive a snow model and its representation of vegetation can affect estimates of how much snow accumulates and melts.
Using changing vegetation conditions may therefore help models represent the effects of canopy shading and other snow–vegetation interactions more accurately. The results also indicate that downscaling weather information to a finer resolution can change simulated snowfall and snow storage, particularly in mountainous areas.
Evidence and caveats
The researchers used eight computer-model experiments covering two California river basins, two weather datasets and two vegetation schemes. They compared the simulations with in-place snow measurements and gridded snow estimates, including SNODAS and UA-SWE, as well as precipitation and temperature comparisons with PRISM.
The comparisons do not point to one uniformly best observational reference. The NLDAS-2 simulations produced snow amounts closer to the in-place measurements but more than the gridded products, while the AORC simulations underestimated snow relative to the in-place data. The researchers note that the in-place precipitation measurements were not corrected for snow-gauge undercatch and that some stations may represent unusually deep snow compared with a 1-kilometer grid cell. Even the dynamic vegetation simulation produced more snow than SNODAS because its modeled leaf area remained higher than the MODIS estimate. The study examined two California basins, so the results do not by themselves establish how the approach will perform elsewhere.
// Source
The cryosphere · 2026 · DOI: 10.5194/tc-20-5973-2026
Authors: Aniket Gupta, Ali Behrangi, P. D. Broxton, Guo‐Yue Niu
Institutions: University of Arizona