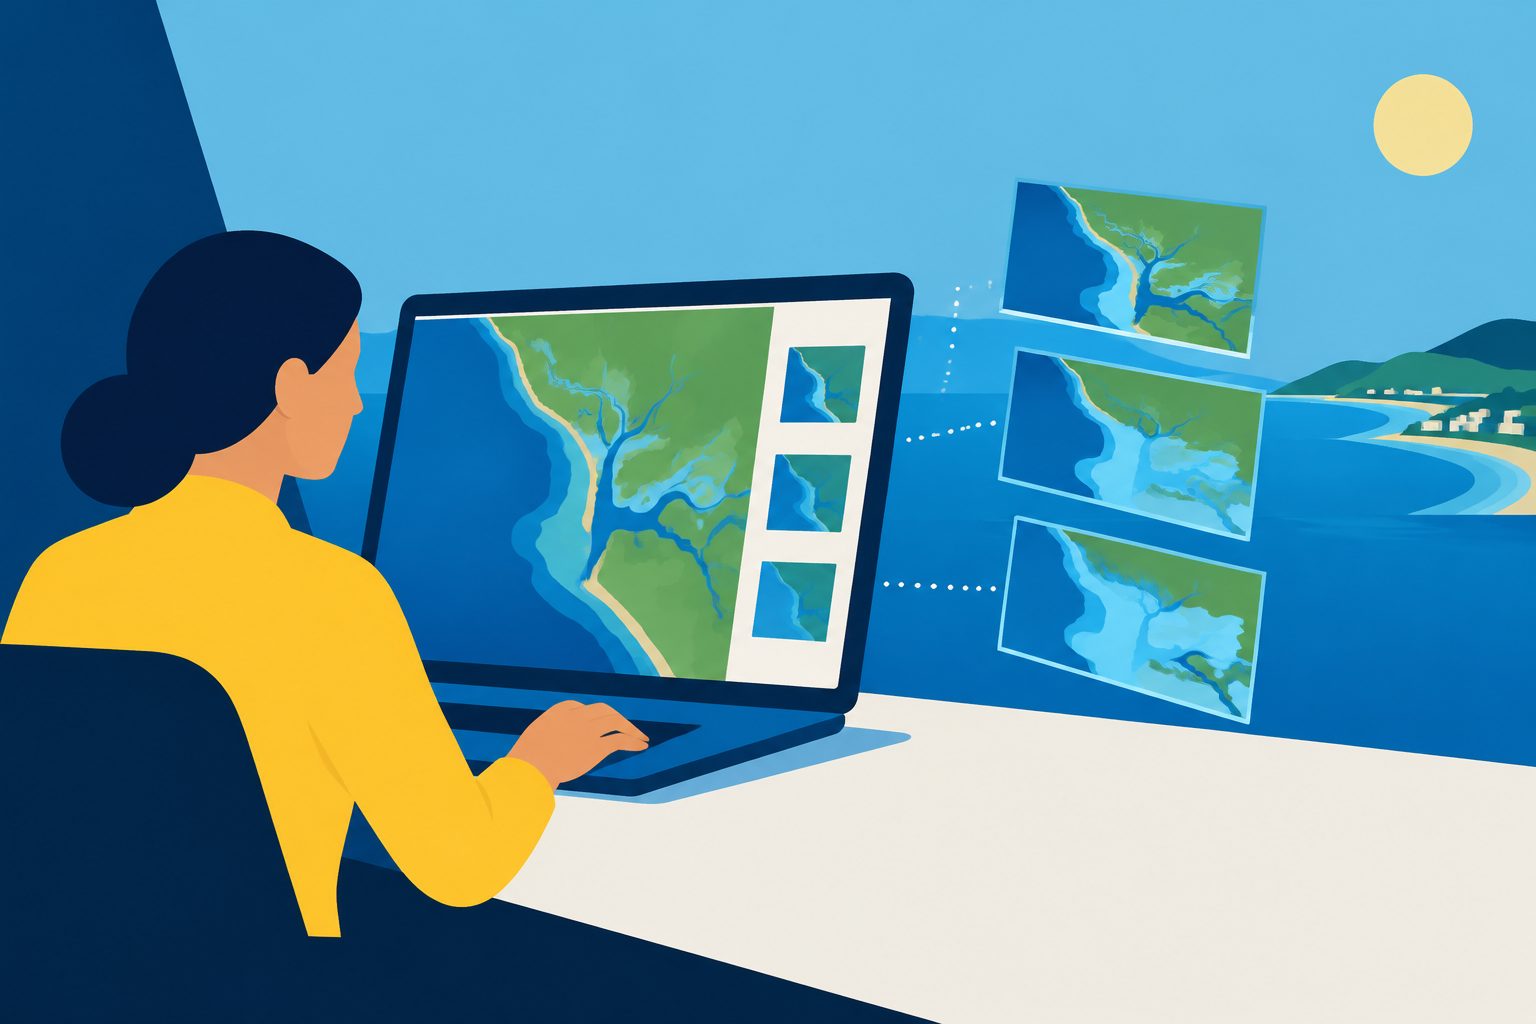
The CCIWR Explorer shows how global models project changes in water, groundwater and evaporation across seasons and years.
The Climate Change Impact of Water Resources Explorer presents projections from multiple global hydrological models. Users can view median changes in total water resources, groundwater and evapotranspiration, as well as the share of models showing a change that stakeholders might consider hazardous.
The application includes two map views and local plots showing the range of projected changes in individual 0.5-degree grid cells. Its developers say it is intended to support adaptation discussions involving water engineers and climate managers, and can also be used directly by students and researchers.
What the tool shows
The Explorer displays projected changes for four seasons or for the year as a whole. It reports both the median change across the model ensemble and the fraction of models projecting a potentially hazardous change, allowing users to consider different levels of risk aversion.
In an online evaluation, 21 pilot users completed two tasks and answered questions about the application. They answered an average of 5 out of 8 questions correctly; only three answered all eight correctly. The reported task times ranged from 4 to 55 minutes, with a median of 21 minutes. More than 60% of users agreed or strongly agreed with statements about the tool's operability. Only 10% to 20% said they saw no benefit in the Explorer, and three of the 21 users said they did not intend to use it again. Satisfaction and correct answers were positively related to user expertise, although the relationship between satisfaction and correct answers was weak.
Why the maps matter
Future water-resource changes are uncertain because different climate and hydrological models can produce different results. The Explorer makes that range visible rather than showing only one projected outcome.
By showing how many models indicate a change that users may classify as hazardous, the tool can help adaptation discussions take account of stakeholder risk tolerance. The researchers recommend that water engineers, climate managers and other experts use it to prepare information for stakeholders, rather than expecting people without relevant background knowledge to interpret it without guidance. Its freely available design and accompanying code may also support similar low-cost tools for other climate impacts.
Evidence and caveats
The evidence for the tool's usability comes from an online survey of 21 pilot users who first completed two tasks. On average, users were satisfied, but the participants had more knowledge about uncertain climate impacts than typical stakeholders. The authors therefore caution that people with less expertise may need help interpreting the maps and plots.
The Explorer presents projections from global hydrological models on a 0.5-degree grid, so its information describes broad areas rather than every local site. The displayed results represent an uncertain range of model projections, not a single known future. The evaluation measured user responses and task performance; it did not establish that using the tool leads to better real-world adaptation decisions.
// Source
Geoscience Communication · 2026 · DOI: 10.5194/gc-9-473-2026
Authors: Petra Döll, Guillaume Attard, Fabian Kneier, Laura Müller
Institutions: Goethe University Frankfurt