A new system estimates emissions from methane super-emitters more accurately in tests and agrees with independent measurements in several real-world cases.
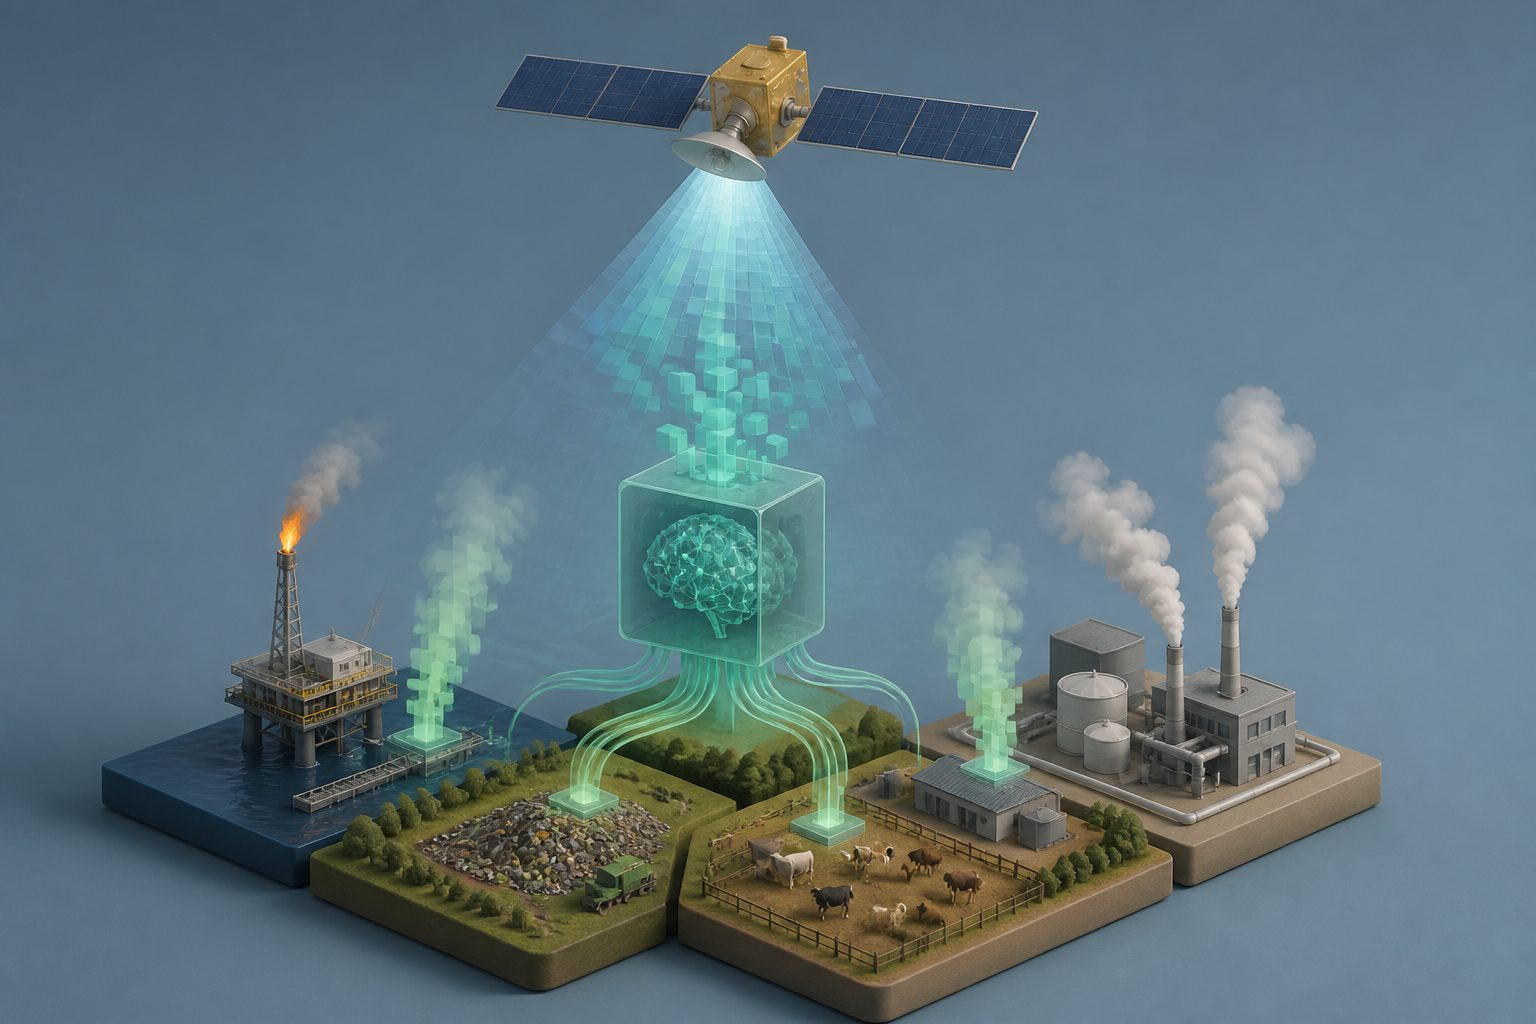
The system, called ML-SPERE, uses a convolutional neural network trained on simulated TROPOMI methane observations and weather data. For well-observed simulated plumes, its median absolute percentage error was 24.3%, compared with 42.4% for the Integrated Mass Enhancement method. It also avoided the negative bias seen with that method at low wind speeds.
When applied to TROPOMI observations of a 200-day gas-well blowout in Kazakhstan, ML-SPERE generally agreed with results from satellite-based inverse modeling and with estimates from high-resolution instruments that detect individual emission sources. Across all TROPOMI super-emitters identified in 2021, the two methods showed broadly similar global patterns and similar average emission rates by source sector, although some regions differed.
How the estimates changed
ML-SPERE performed better than the Integrated Mass Enhancement method on simulated methane plumes that included real TROPOMI background conditions and missing spatial data. For well-observed plumes, it reduced the median absolute percentage error from 42.4% to 24.3%. At low wind speeds, the older method tended to underestimate emissions, while ML-SPERE did not show that bias in the simulations.
For the Kazakhstan well blowout, ML-SPERE estimates typically agreed with estimates from TROPOMI inverse modeling and the Integrated Mass Enhancement method. They also agreed better with estimates made by high-resolution point-source imagers. Global results from the two methods were broadly consistent, with notable differences in northern Russia, the Congo Basin and southeastern Australia.
Why methane estimates matter
Methane is the second most important human-caused greenhouse gas and has more than 80 times the warming potential of carbon dioxide over 20 years. Because methane remains in the atmosphere for about a decade, finding and measuring large emissions can support efforts to limit near-term warming.
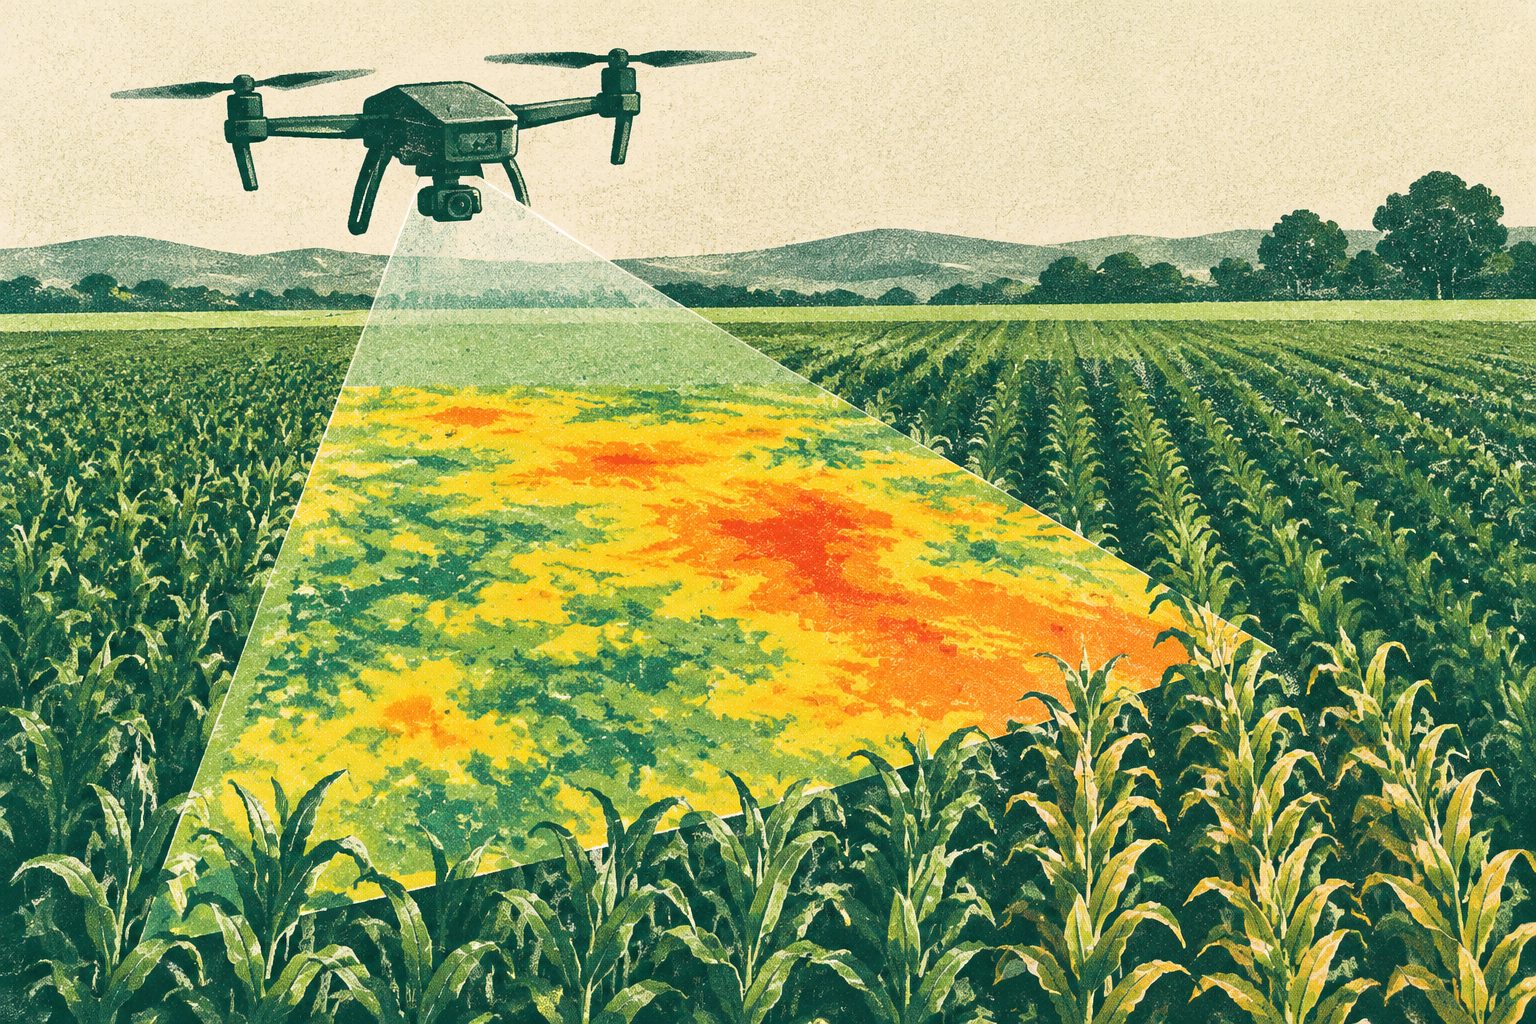
TROPOMI provides daily, worldwide methane observations. A method that estimates emission rates more reliably from those observations could help researchers quantify major sources and compare emissions across regions. The study indicates that machine learning can improve estimates in some conditions, particularly where low wind speeds or incomplete satellite data affect existing calculations.
Evidence and caveats
The strongest numerical comparison came from simulated TROPOMI plumes, rather than direct measurements of every real-world source. The researchers also tested the system against real satellite observations of one 200-day well blowout in Kazakhstan and compared its results with satellite inverse modeling, a standard estimation approach, and high-resolution point-source imagers.
The abstract does not report a single overall error rate for all real-world sources. It notes that neither method may fully characterize transient pipeline emissions in northern Russia or area-source emissions in the Congo Basin. Integrated Mass Enhancement estimates may also be negatively biased in southeastern Australia because winds there are often low. The study found similar average emission rates by source sector despite these regional differences.
// Source
Atmospheric measurement techniques · 2026 · DOI: 10.5194/amt-19-5659-2026
Authors: Clayton Roberts, Joannes D. Maasakkers, Tobias A. de Jong, Berend J. Schuit, Shubham Sharma, Théo Huegens, Anne-Wil van den Berg, Sander Houweling, Ilse Aben
Institutions: Vrije Universiteit Amsterdam, Wageningen University & Research, Space Research Organisation Netherlands, GHGSat (Canada)