The open tracker recalculates water estimates for 10 sites, flags planning figures and records water use shifted into electricity generation.
A Zenodo working note presents an open Python tool for checking estimates of the water burden linked to AI data centres. It rebuilds a water-use index for 10 sites from public reports and water records, and adds accounting for hydropower links and water use moved into electricity generation.
On the modelled inputs used, the note finds that closed-loop cooling does not eliminate most of the water footprint: it relocates roughly 92% to 95% of it to the power grid. It also identifies planning figures described as measurements and reports substantial year-to-year changes when the calculation is rerun with operators’ FY2025 reports.
What the tracker found
The working note rebuilds the Water Consumption Impact index used in an earlier study for 10 seed sites, using public operator environmental reports, utility records, USGS streamflow data and USBR reservoir studies. It checks each recomputed value against the earlier published figure.
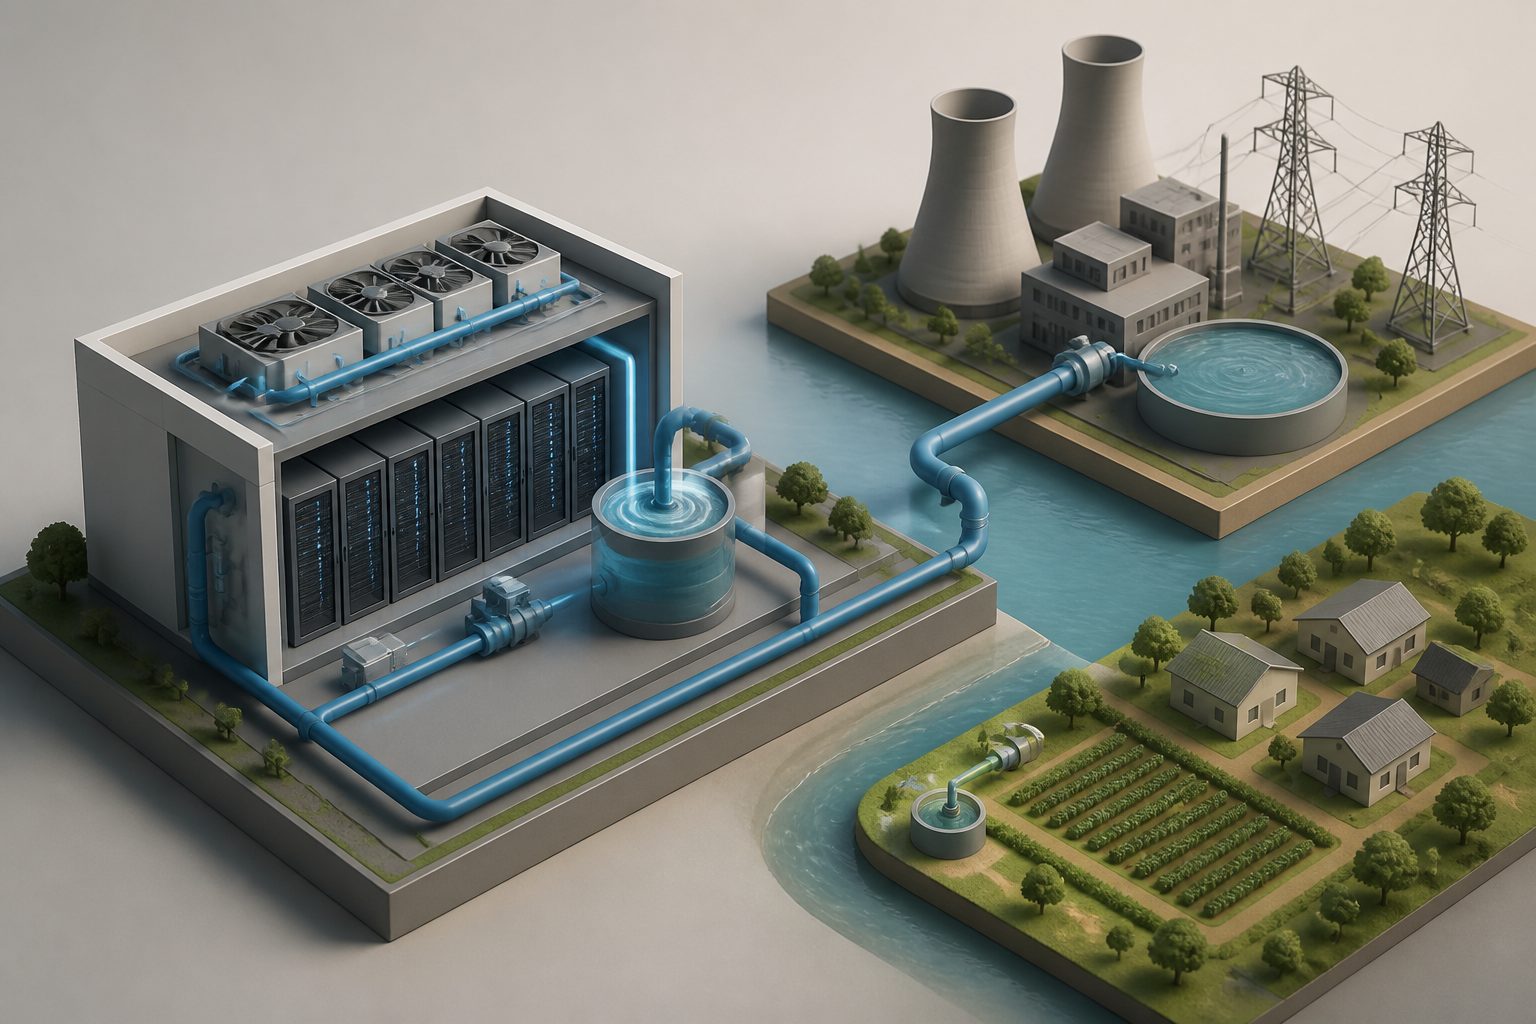
It adds two features: a flag for links between a data centre and hydropower reservoirs, asserted from primary reservoir data for two sites, and a ledger for water use moved off-site into electricity supply. On the modelled inputs, closed-loop cooling relocates roughly 92% to 95% of the water footprint to the grid, with that direction unchanged across the plausible variations tested.
The note says three of the 10 sites, involving three operators, are non-operational planning figures presented as measured values; it excludes them from the measured set. When the index is recalculated using operators’ FY2025 reports while holding capacity and peaking constant, five of the six primary-verified sites rise by 15.6% to 33.3% in one reporting year. The sixth is unchanged in total withdrawal, but its use of potable municipal water rises by more than sixfold.
Evidence and caveats
This is a working note deposited in Zenodo, not a report of a controlled experiment. It reconstructs an index for 10 sites using public operator reports, utility records, USGS streamflow data and USBR reservoir studies, then checks the calculations against previously published values. Some inputs are modelled or estimated rather than measured, and the site set comes from an earlier study. The tracker covers the sources and assumptions it names; it does not establish that its estimates apply to all AI data centres. The author discloses AI assistance in retrieval, calculations, literature searches and drafting, as well as potential conflicts involving two AI companies and data-centre development.
// Source
Zenodo (CERN European Organization for Nuclear Research) · 2026 · DOI: 10.5281/zenodo.21318960
Authors: N Milton