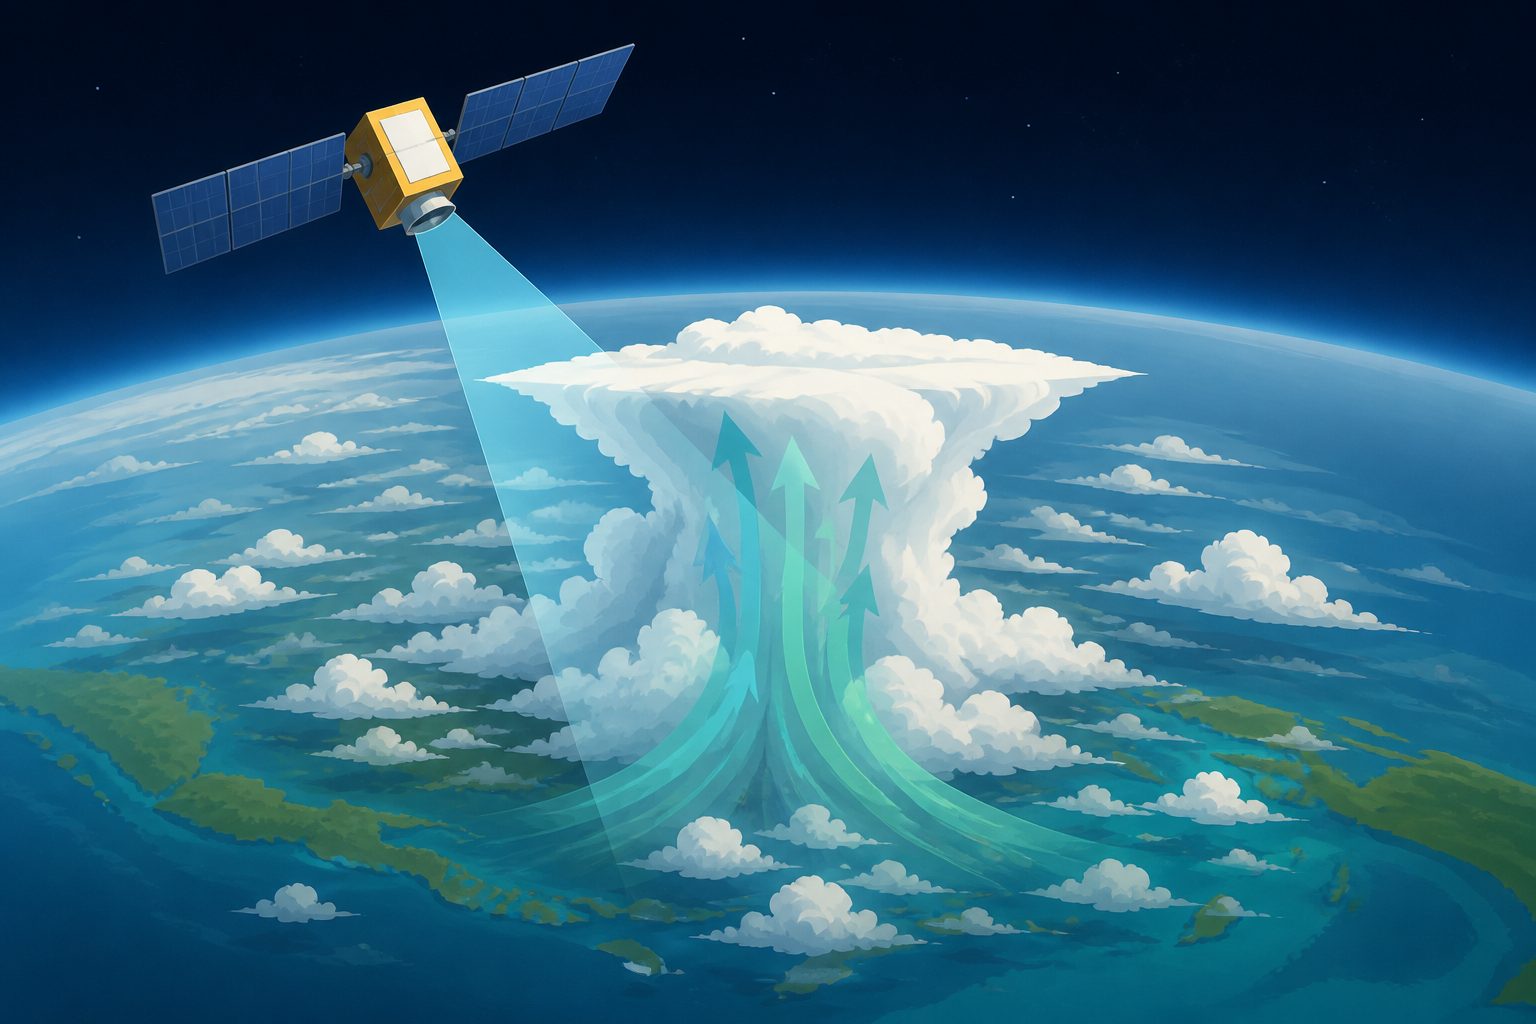
New measurements show where the strongest rising air occurs and how it changes between land and ocean.
Researchers used measurements from EarthCARE’s 94-gigahertz Cloud Profiling Radar to study upward air motion in tropical clouds. They classified cloud columns as having strong updrafts when the maximum upward speed in the portion below freezing exceeded 2.5 metres per second.
These strong-updraft columns had higher radar echo tops than weaker-updraft columns, but their occurrence was especially closely related to the gap between the cloud top and the 0-decibel radar echo top. Strong updrafts were more common over land and during the 14:00 local-time pass than during the 02:00 pass. Oceanic regions showed fewer strong-updraft columns and a smaller difference between the two observation times.
Where strong updrafts occur
The study identified tropical cloud columns with strong updrafts using the maximum upward Doppler velocity measured in each column’s below-freezing region. Columns with a maximum upward velocity above 2.5 metres per second were classified as strong-updraft columns.
These columns generally had higher radar echo tops at both 0 and 10 decibels than weaker-updraft columns, linking stronger rising air with differences in cloud particles and structure. The strongest indicator of a strong updraft was often a small gap between the cloud top and the 0-decibel echo top, including in clouds that did not reach especially high altitudes.
Strong-updraft columns occurred more often over land, particularly during the satellite’s 14:00 local-time overpass. Over the ocean, they were less frequent and showed a smaller contrast between the two overpass times. The land-based increase mainly reflected more horizontally compact cloud systems with small gaps between their tops and 0-decibel echo tops, rather than simply more high-reaching clouds. Doppler folding—an ambiguity in measuring very high velocities—was most common in these compact systems during continental afternoons and may serve as a qualitative indicator of extreme updrafts.
A test for cloud models
Rising air inside clouds affects how clouds transport heat, water and particles through the atmosphere, making updraft strength relevant to the climate system. Until now, global studies have generally inferred this strength from indirect indicators.
EarthCARE’s measurements provide a way to compare observed updraft intensity with cloud structure around the world. The combined information could be used as a process-based benchmark for testing whether numerical weather and climate models correctly represent the connection between cloud dynamics—the movement of air—and cloud microphysics, the processes involving cloud droplets and ice particles.
What the measurements show
The findings come from an analysis of cloud-property and Doppler-velocity profiles collected by EarthCARE’s 94-gigahertz Cloud Profiling Radar over the tropics. The study uses a stated threshold of more than 2.5 metres per second to define strong-updraft columns and examines their cloud structure, location and observation time.
The abstract does not report the number of cloud columns analyzed, uncertainty estimates or independent validation against other measurements. The results also describe satellite-observed patterns and a classification scheme; they do not by themselves establish why the land–ocean or time-of-day differences occur. Doppler folding is presented as a qualitative tracer of extreme updrafts, not as a direct quantitative measurement of their full strength.