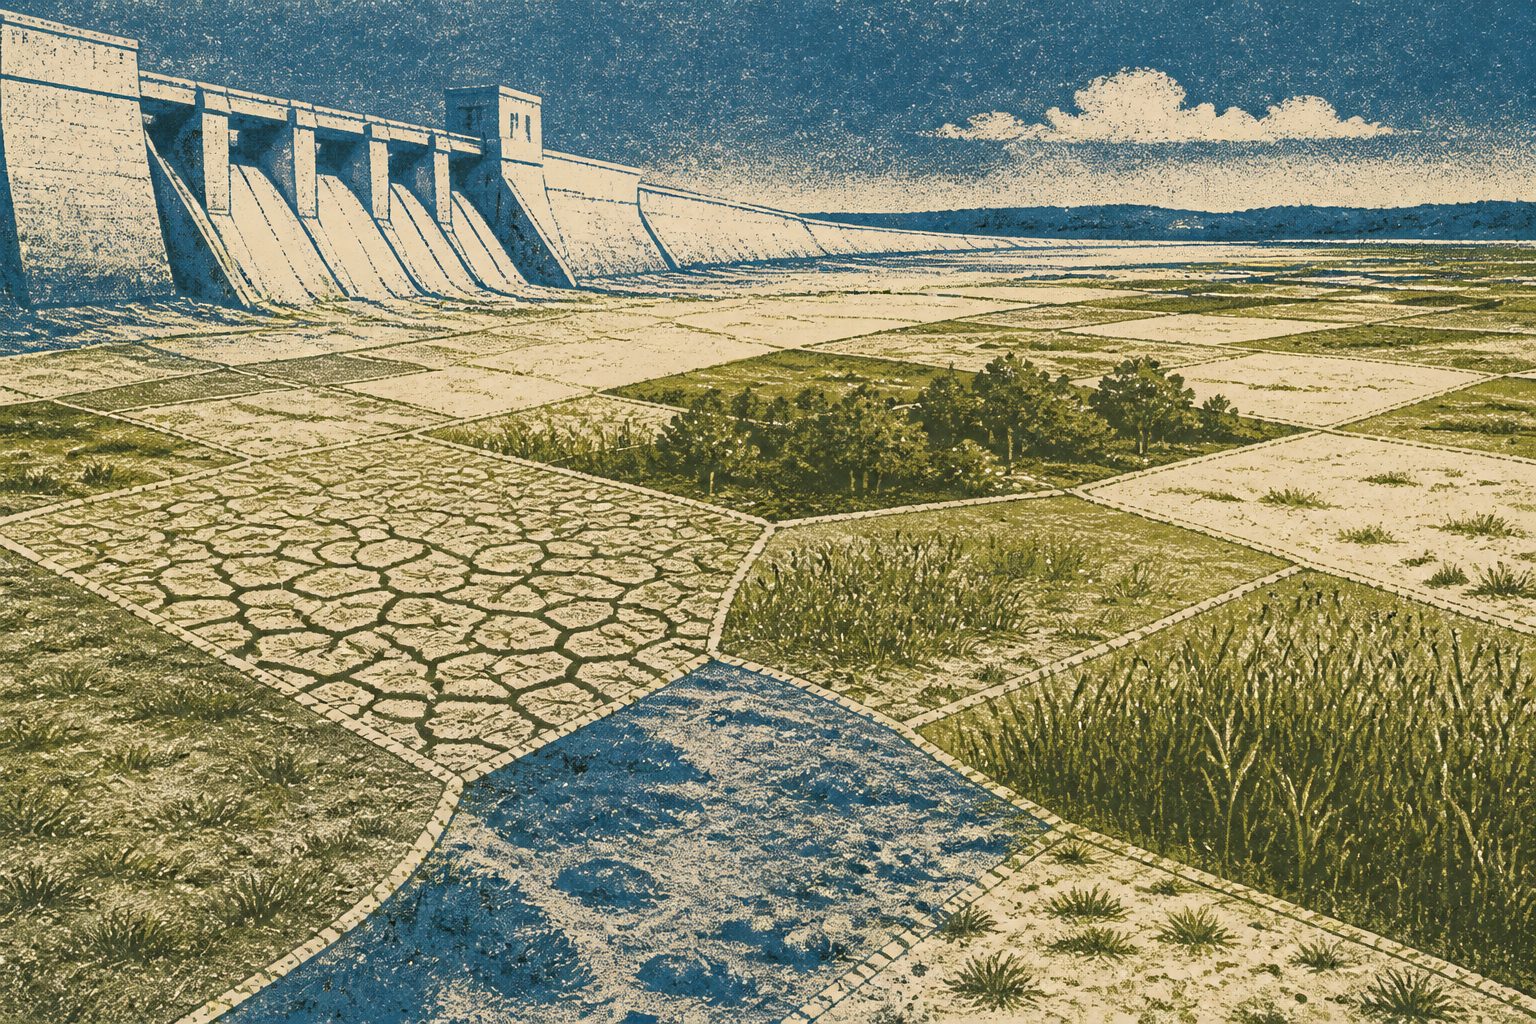
Satellite observations show expanding vegetation alongside shrinking residual water and continuing heat and moisture stress.
Researchers used Sentinel-2 and Landsat 8/9 satellite observations to track surface changes across the former Kakhovka Reservoir bed between August 2023 and August 2025. They classified areas as residual water, dry sandy or muddy surfaces, wet or waterlogged surfaces, or surfaces showing a distinct vegetation signal.
Residual water declined from 312.7 square kilometers to 136.2 square kilometers, while areas with a distinct vegetation signal grew from 265.4 square kilometers to 1,315.7 square kilometers. The researchers describe the bed as a rapidly reorganizing landscape in which early vegetation establishment and possible surface stabilization coexist with persistent ecological risks.
How the reservoir bed changed
The dominant change was the conversion of flat, dry muddy surfaces into areas with a distinct vegetation signal, covering 540.7 square kilometers. Between 19 August 2023 and 19 August 2025, residual water fell from 312.7 to 136.2 square kilometers, while vegetation-signal areas increased from 265.4 to 1,315.7 square kilometers.
The study’s Degradation State Difference Index, an author-proposed measure of surface degradation, showed that areas with the highest degradation scores fell from 1,067.7 square kilometers in summer 2023 to 127.9 square kilometers in summer 2025. However, large areas still showed heat and moisture stress. In 2025, vegetation and moisture indicators were strongly positively associated, while each was negatively associated with land-surface temperature.
Why the new landscape matters
The findings show that the former reservoir bed is not simply remaining as a degraded, exposed surface. It is developing into a mixed landscape with early vegetation, declining residual water and signs consistent with increasing surface stability, while ecological stresses remain across large areas.
That combination matters for understanding how the reservoir bed is changing after the dam breach. The study provides a way to track the balance between vegetation establishment and continuing heat and moisture stress across a very large area.
Satellite evidence and limits
The study is based on multi-temporal Sentinel-2 and Landsat 8/9 satellite data processed in Google Earth Engine. It combines surface classification, changes over time, a transition analysis, the author-proposed Degradation State Difference Index and statistical associations between vegetation, moisture and temperature indicators.
These observations describe surface patterns rather than directly measuring species, soil processes or long-term ecosystem recovery. The abstract does not report independent field validation of the classifications or the proposed index, and the reported relationships between indicators are associations rather than proof that one factor caused another.
// Source
Journal of Landscape Ecology · 2026 · DOI: 10.2478/jlecol-2026-0039
Authors: Nataliya Magas
Institutions: Admiral Makarov National University of Shipbuilding